
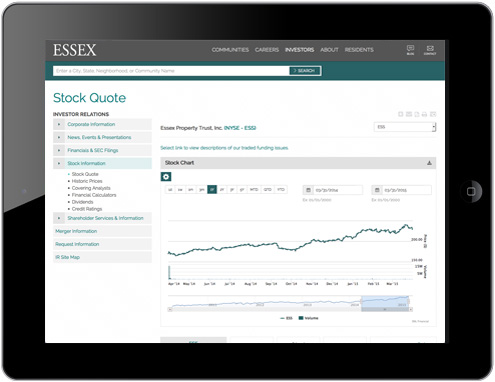
Investors track key metrics their way with our exclusive interactive charting.
Our advanced charting allows investors to compare peers, graph indices, create Excel® models and add contextual events like press releases and dividends. Analysts and shareholders gain a more complete picture of your company's performance over time, and use your site to answer their own questions instead of relying on timely responses from you.
Dynamically deliver the data
investors want and the tools to analyze it.
Comprehensive data is dynamically updated directly from your SEC filings and press releases. As-reported financial pages are automatically updated from your public filings each quarter, and each data point is source-tagged to the original document for full transparency. With interactive charting, investors can visualize each line item's performance over time.
Contact us
To learn more about SNL IR Solution, call 866.296.3743, email us at irsales@snl.com. Or, visit SNL IR Solutions.
Also Visit SNL.com